Sunday, October 11, 2020

Classification of road signs

Classification of road signs

Traffic signs are means for exercising control on or passing information to the road users. They may be regulatory, warning, or informative.

They can be classified into three main categories

  • Regulatory signs: These signs require the driver to obey the signs for the safety of other road users. 
  • Warning signs:These signs are for the safety of oneself who is driving and advice the drivers to obey these signs.
  • Informative signs: These signs provide information to the driver about the facilities available ahead, and the route and distance to reach the specific destinations 

 
Special types of traffic signs namely work zone signs are used to give warning to the road users when some construction work is going on the road. They are placed only for short duration and are removed soon after the work is over and when the road is brought back to its normal condition.
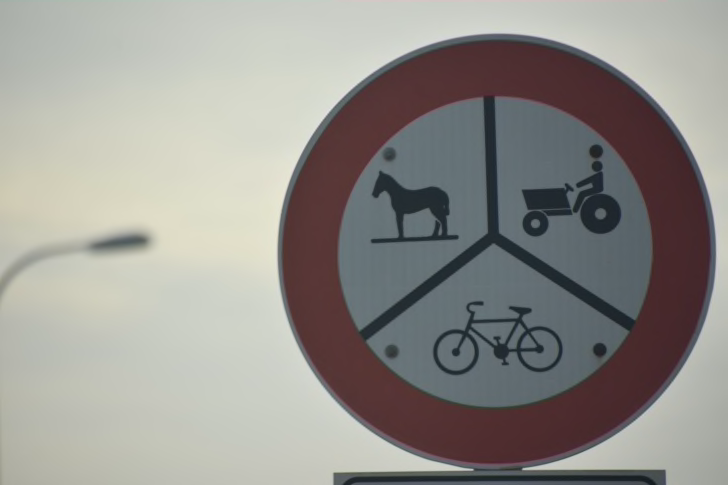
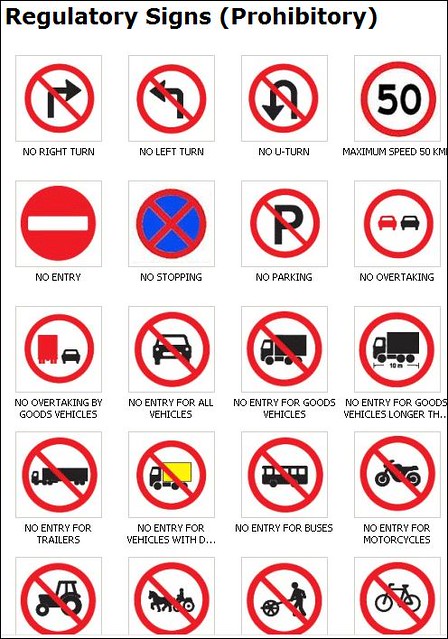
Regulatory signs

These signs are also called mandatory signs because it is mandatory that the drivers must obey these signs. If the driver fails to obey them, the control agency has the right to take legal action against the driver. These signs are primarily meant for the safety of other road users. These signs have generally black legend on a white background. They are circular in shape with red borders. The regulatory signs can be further classified into :
  1. Right of way series: These include two unique signs that assign the right of way to the selected approaches of an intersection. They are the STOP sign and GIVE WAY sign For example, when one minor road and major road meets at an intersection, preference should be given to the vehicles passing through the major road. Hence the give way sign board will be placed on the minor road to inform the driver on the minor road that he should give way for the vehicles on the major road. In case two major roads are meeting, then the traffic engineer decides based on the traffic on which approach the sign board has to be placed. Stop sign is another example of regulatory signs that comes in right of way series which requires the driver to stop the vehicle at the stop line.
  2. Speed series: Number of speed signs may be used to limit the speed of the vehicle on the road. They include typical speed limit signs, truck speed, minimum speed signs etc. Speed limit signs are placed to limit the speed of the vehicle to a particular speed for many reasons. Separate truck speed limits are applied on high speed roadways where heavy commercial vehicles must be limited to slower speeds than passenger cars for safety reasons. Minimum speed limits are applied on high speed roads like expressways, freeways etc. where safety is again a predominant reason. Very slow vehicles may present hazard to themselves and other vehicles also.
  3. Movement series: They contain a number of signs that affect specific vehicle maneuvers. These include turn signs, alignment signs, exclusion signs, one way signs etc. Turn signs include turn prohibitions and lane use control signs. Lane use signs make use of arrows to specify the movements which all vehicles in the lane must take. Turn signs are used to safely accommodate turns in unsignalized intersections.
  4. Parking series: They include parking signs which indicate not only parking prohibitions or restrictions, but also indicate places where parking is permitted, the type of vehicle to be parked, duration for parking etc.
  5. Pedestrian series: They include both legend and symbol signs. These signs are meant for the safety of pedestrians and include signs indicating pedestrian only roads, pedestrian crossing sites etc.
  6. Miscellaneous: Wide variety of signs that are included in this category are: a "KEEP OF MEDIAN" sign, signs indicating road closures, signs restricting vehicles carrying hazardous cargo or substances, signs indicating vehicle weight limitations etc.
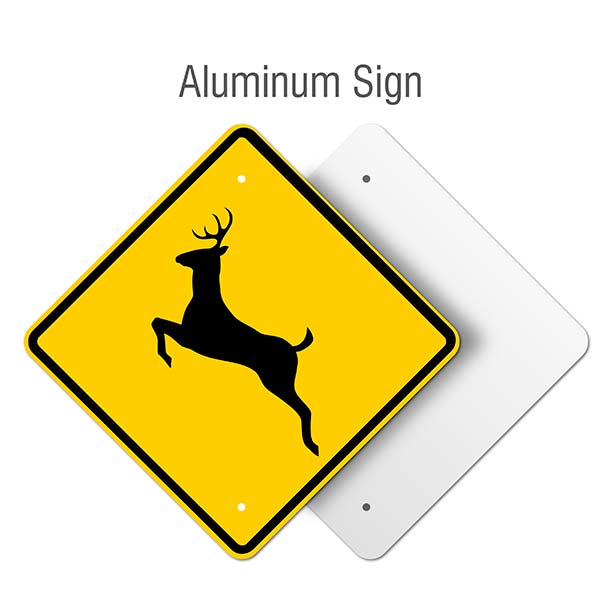
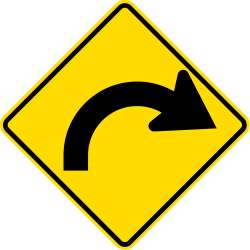
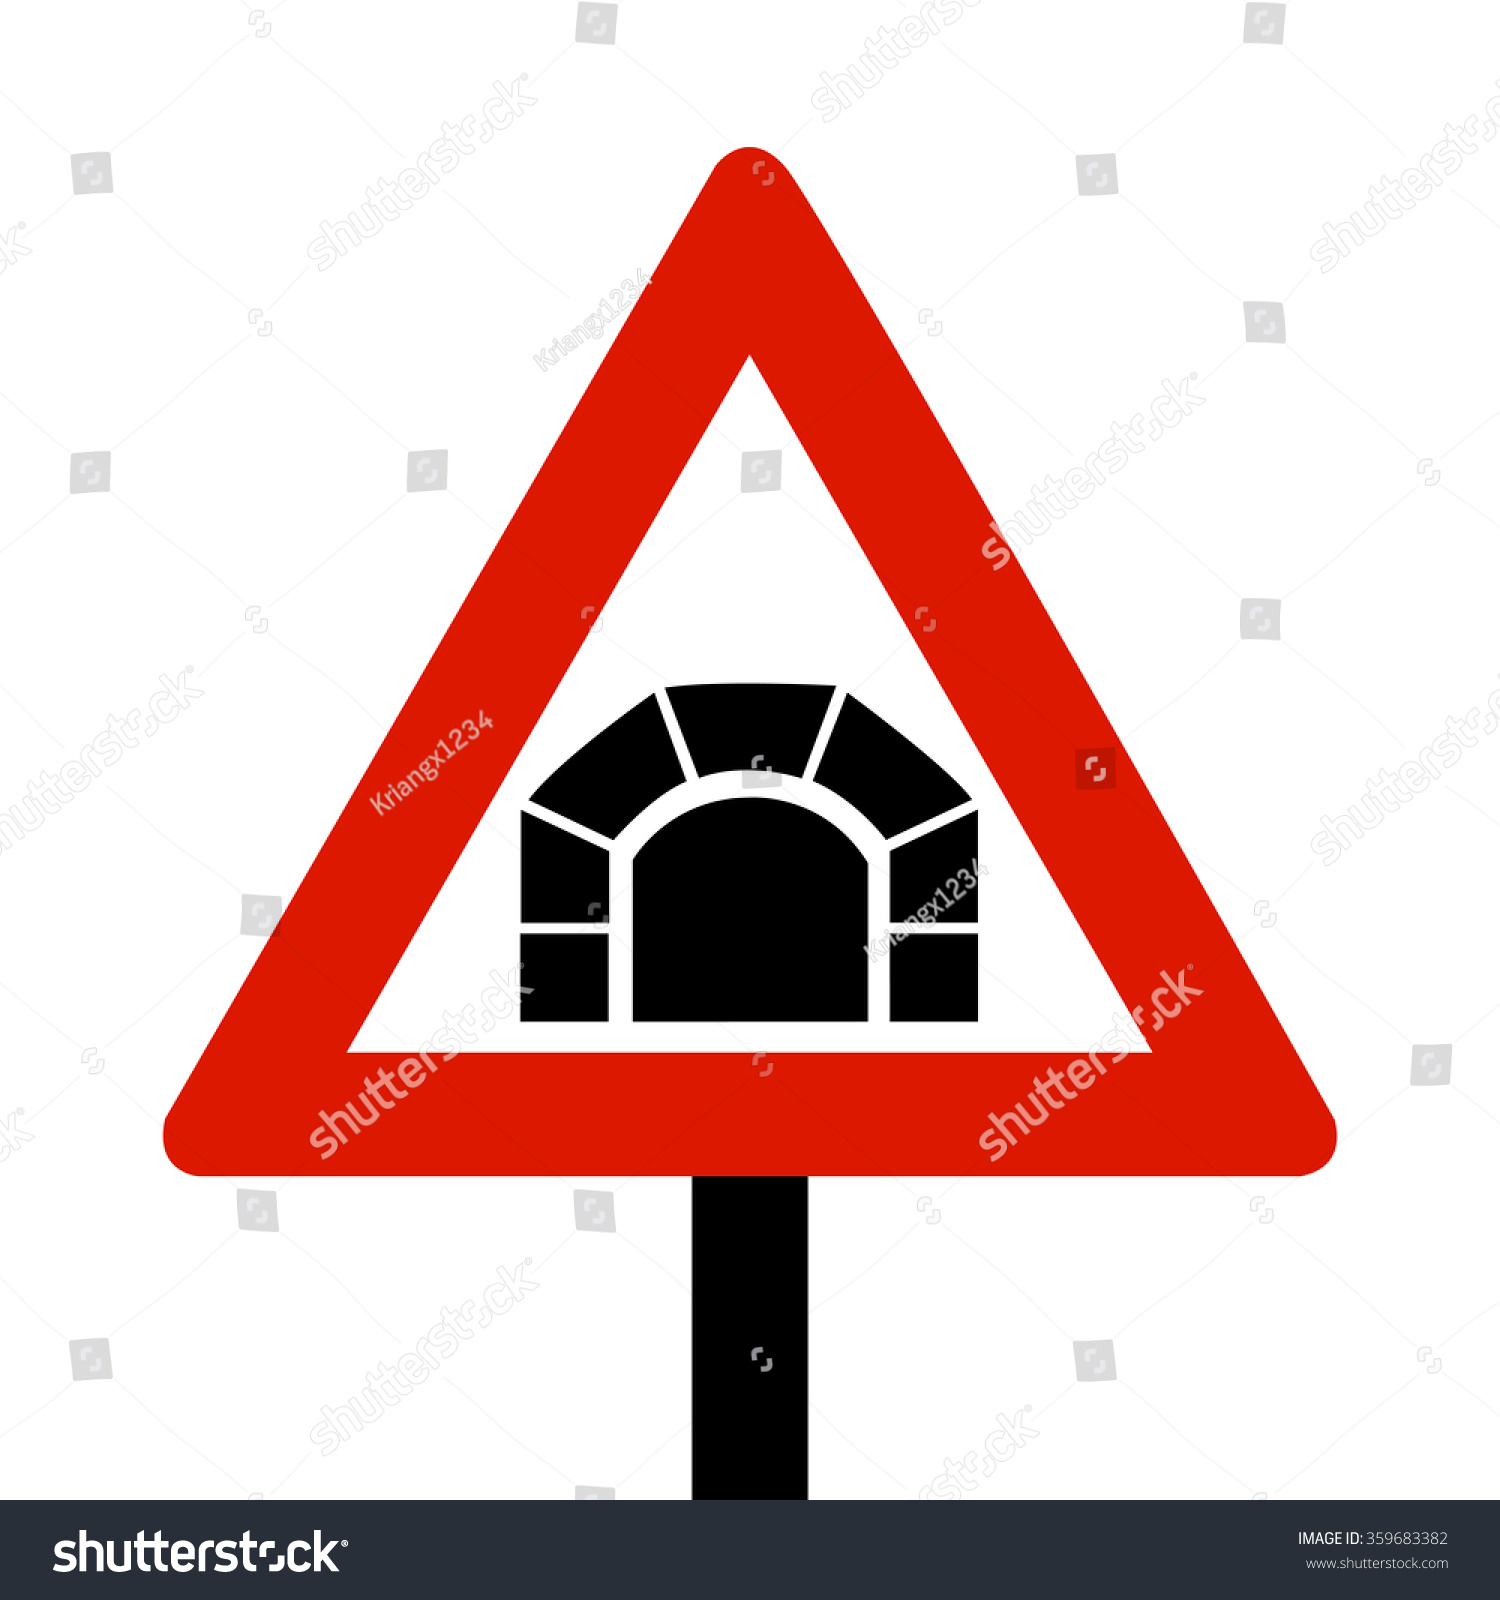
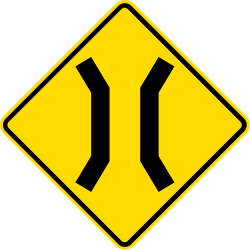
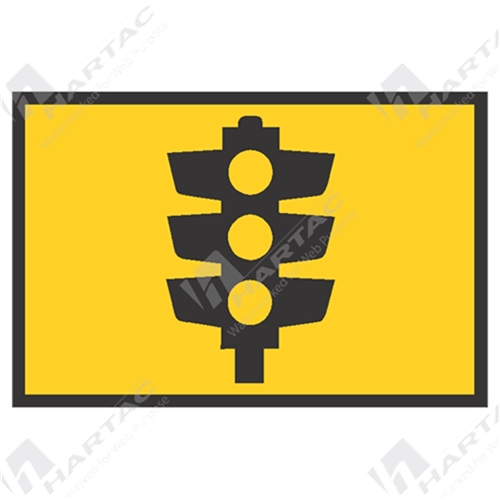

Warning signs

Warning signs or cautionary signs give information to the driver about the impending road condition. They advice the driver to obey the rules. These signs are meant for the own safety of drivers. They call for extra vigilance from the part of drivers. The color convention used for this type of signs is that the legend will be black in color with a white background. The shape used is upward triangular or diamond shape with red borders. Some of the examples for this type of signs are shown below
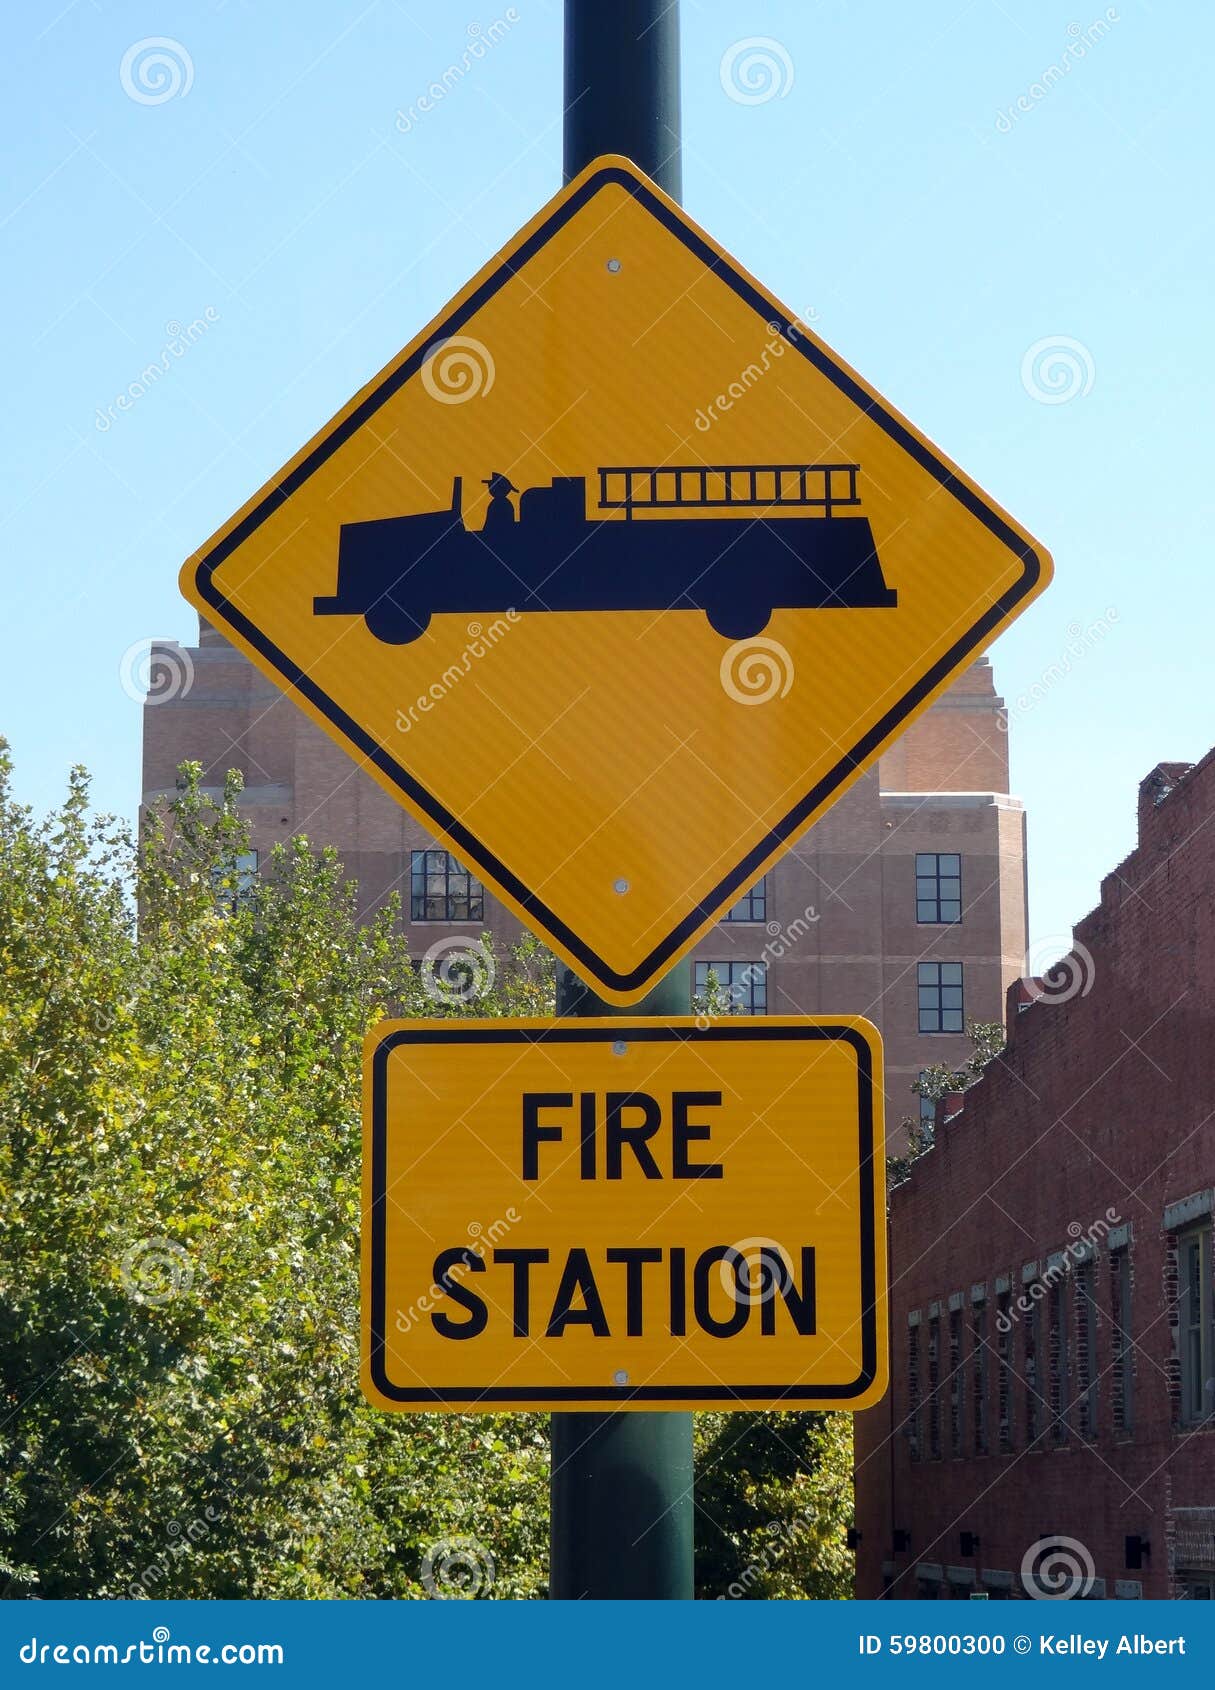
\begin{figure}\centerline{\epsfig{file=t23-cautionary-signs.eps,width=8cm}}\end{figure}

Informative signs

Informative signs also called guide signs, are provided to assist the drivers to reach their desired destinations. These are predominantly meant for the drivers who are unfamiliar to the place. The guide signs are redundant for the users who are accustomed to the location.

Some of the examples for these type of signs are route markers, destination signs, mile posts, service information, recreational and cultural interest area signing etc. Route markers are used to identify numbered highways. They have designs that are distinctive and unique. They are written black letters on yellow background. Destination signs are used to indicate the direction to the critical destination points, and to mark important intersections. Distance in kilometers are sometimes marked to the right side of the destination. They are, in general, rectangular with the long dimension in the horizontal direction. They are color coded as white letters with green background.

Mile posts are provided to inform the driver about the progress along a route to reach his destination. Service guide signs give information to the driver regarding various services such as food, fuel, medical assistance etc. They are written with white letters on blue background. Information on historic, recreational and other cultural area is given on white letters with brown background.


SPF

SAFETY PERFORMANCE FUNCTION

A safety performance function (SPF) is an equation used to predict the average number of crashes per year at a location as a function of exposure and, in some cases, roadway or  intersection characteristics. In case of a section of a highway, exposure is represented by the corresponding length and annual average daily traffic (AADT).

One of the main goals is to calibrate Safety Performance Functions (SPFs) that can predict the frequency per year of injuries and fatalities on homogeneous road segments.  Analysis of accident data confirms the effectiveness of the SPFs.  Using previous data of crash, traffic, and road inventory data for various roads, fixed- and random-parameter count data models are calibrated. However, it has been seen that accidents are greater in number than the predictions made by the Safety Performance Functions. Hence, an area specific random parameter poisson’s SPF gives the best-fit random parameter SPF specification for crash frequency. It includes the following variables -  annual average daily traffic, segment length, shoulder width, lane width, speed limit, and the presence of passing lanes. Hence, heterogeneity-based models can be specified and used for obtaining accurate crash predictions.

Predicted Crashes = exp[α + β * ln(AADT) + ln(Segment Length)]

For intersections, exposure is represented by the AADT on the major and minor intersecting roads

Predicted Crashes = exp[α + β1 * ln(AADTmajor) + β2 * ln(AADTminor)]

Example: The SPF from the Highway Safety Manual for total Multiple Vehicle (MV) crashes at urban, four-legged signalized intersections using the above equation where α, β1 and β2 were  calculated separately is:

Predicted MV crashes = exp[-10.99 + 1.07*ln(AADTmajor) + 0.23*ln(AADTminor)]

For an urban, four-legged signalized intersection with a major road traffic volume (AADTmajor) of 25,000 vehicles per day and a minor road traffic volume (AADTminor) of 10,000 vehicles  per day, the predicted number of MV crashes is computed as follows for the given SPF.

Predicted MV crashes = exp[-10.99 + 1.07*ln(25,000) + 0.23*ln(10,000)] = 7.13 crashes/year

SPFs are used to predict crash frequency for a given set of site conditions. The predicted crashes from the SPF can be used alone or in combination with the site-specific crash history  (i.e., Empirical Bayes method) to compare the safety performance of a specific site under various conditions. The Empirical Bayes method is used to estimate the expected long-term  crash experience, which is a weighted average of the observed crashes at the site of interest and the predicted crashes from an SPF

The predicted number of crashes calculated using SPFs is instrumental for a number of activities in the project development process, including

1)      Network screening,

2)      Countermeasure comparison, and

3)      Project evaluation.

 Network Screening

SPFs can be used in the network screening process to determine whether the observed safety performance at a given location is higher or lower than the average safety performance of other sites with similar roadway characteristics and exposure. This is useful in the safety management process to identify sites with potential for safety improvement.

 Countermeasure Comparison

SPFs can be used to predict the baseline crash frequency for given site conditions when comparing potential countermeasures. SPFs are used alone or in conjunction with the crash history to estimate the long-term crash frequency for baseline conditions (without treatment) and crash modification factors (CMFs) are applied to estimate the crashes with treatment as shown in Equation 3. This is useful in activities where there are multiple alternatives to address safety concerns and it is desirable to quantify and compare the potential benefits of each treatment.

 Project Evaluation

It is important to evaluate the safety effectiveness of roadway improvements to provide input to future planning, policy and programming decisions. The current state-of-the-practice is to employ the Empirical Bayes method in an observational before-after study to develop CMFs. SPFs are a critical component of the Empirical Bayes method, which combines the crash history for a given site with the predicted crashes from an SPF. In particular, the SPF helps to account for changes in traffic volume over time.

Wednesday, October 7, 2020

Basic concepts of road accident statistics

BAYESIAN STATISTICS  AND BASIC CONCEPTS OF ROAD ACCIDENT STATISTICS

  • Bayesian statistics is different from classical statistics\
  • Bayesian statistics is a mathematical framework to update your beliefs as you observe more data

For example, lets consider an accident
Try recollecting the events that occurred just before an accident (This is called PRIOR)
Occurrence of event (Accident) = DATA
As more DATA is observed = BELIEF is UPDATED = POSTERIOR
Accident is an event with TWO outcomes (YES or NO)
Point data (YES or NO)
Accident is a RANDOM VARIABLE (YES = X & NO = 1-X)
RANDOM VARIABLE
Start with the objective (Accident | Data)
CONDITIONAL PROBABILITY ->  If PRIOR says there cannot be an accident, the BELIEF cannot be changed.

***Baye's rule***

More data = More precise predictions
Data is huge (difficult to compute) -> CHOP IT INTO PIECES (LARGE or unmanageable to SMALL CHUNKS or manageable pieces)
Belief propagation in graphical models
Approximation -> Variational Bayes
More data to update beliefs
Use previous outputs as priors and subsequently update
Belief influences results (Very subjective) similarly Prior is subjective
Frequentists NOT INTERESTED in SINGLE EVENTS
BAYESIAN statistics deals with UNCERTAIN EVENTS wheras FERQUENTIST statistics deals with REPEATABLE EVENTS
Bayesian statistics
can:
-incorporate prior knowledge easily
-update beliefs easily
-tackle a wider set of problems as probabilities are BELIEFS
However, bayesian statistics MUST SPECIFY A MODEL
BELIEFs are SUBJECTIVE!
Frequentist statistics
-has non-parametric methods
-probabilities are objective
-hard to cheat
-are focused on repeatable events
-prior knowledge is introduced using and ad-hoc format
-requires a huge data
FREQUENTIST and BAYESIAN statistics use the SAME RULES OF PROBABILITIES
Difference exists in set-up of WHAT IS RANDOM
Bayesian statistics uses UNCERTAINTY IN KNOWLEDGE
Frequentist statistics uses INTRINSIC RANDOMNESS
Usage of either methods is acceptable depending on DATA AVAILABLE and CONSISTENCY
BAYESIAN STATISTICS IS A FUNDAMENTALLY DIFFERENT APPROACH
TO STATISTICS
It is an associated set of MATHEMATICAL tools
In BAYESIAN approach, DATA is FIXED and PARAMETERS may VARY
Frequentist
statisticians talk about CONFIDENCE INTERVALS while BAYESIAN STATISTICIANS talk about CREDIBLE INTERVAL
Baye's theorem talks about
-Posterior
-Likelihood
-Prior
-Evidence
Posterior = (likelihood * prior)/Evidence
Strength of Prior
Usefulness of Baye's statistics in case of
-Sparse data
-Abundant data and
-Uniform prior
Source of priors
Mathematical tools in Baye's statistics
-Analytical methods
-Grid approximation
-Markov chain monte carlo simulation
MCMC
-It is an algorithm for exploring parameter space
-Time spent at each point approximates parameter distribution
-Examples include Metropolis-Hastings, Gibbs sampling, etc
Bayesian methods perform extremely well in complex (hierarchical models)
Bayesian methods should be used in case of complex models with many interacting parameters
Bayesian methods are preferred when assumptions CANNOT be made regarding estimates and the data is messy (disorganised, missing data (gaps))
 

Bayesian road safety analysis

  • Bayesian statistics for determining hazardous road locations
  • Hazardous locations that are prone to traffic accidents are called "BLACK SPOTS".
  •  Identifying these black spots help in scheduling road safety policies. 
  • A bayesian estimation of the model via a Markov Chain Monte Carlo (MCMC) approach is used.
  • Black spots are dangerous locations where accidents occur. Treating black spots is a well known and frequently used means of improving road safety. 
  • Black spots are spatial concentrations of interdependent high-frequency accident locations. 
  • From a statistical point of view, road accidents are treated as random events. As a matter of fact they are indeed unintentional result of human behaviour. 
  • Hence, it is impossible to predict the exact circumstance of every accident. 
  • There are several statistical models to analyse black spot data. 
  • Most accidents follow the Poisson probability law. 
  • In order to correct the extra Poisson variation found in accident counts, binomial regression models are used. 
  • Most recently, Bayesian techniques have been used to handle problems in traffic safety. 
  • To estimate accident frequencies, a hierarchical bayesian poisson model is used. 
  • Identification of sites that are more dangerous than others (black spots) help in better scheduling road safety policies. 
  • Bayesian estimation for the model using a Markov chain Monte Carlo is proposed. 
  • The problem of identifying black spots is difficult since accidents are rare events and observed data is not necessarily a good indicator as it simply extracts data from an underlying density distribution.
  • Policy making has a tremendous impact on society as it can reduce the accidents at a particular site.
  • The hierarchical procedure for ranking sites takes into account fatalities and injuries at all levels; combines this information by means of a cost function to rank the sites.

Road signs and traffic signals

ROAD SIGNS

Road Signs:
Road signs are signs erected at the side of or above roads to give instructions or provide information to road users.  They are also called traffic signs. Various international conventions have helped to achieve a degree of uniformity in road signs in various countries. Traffic signs can be grouped into several types.  According to the Vienna Convention on Road Signs and Signals (1968), eight categories of signs have been defined which are listed below:
Danger warning signs
A warning sign is a type of sign which indicates a potential hazard, obstacle, or condition requiring special attention. Some are traffic signs that indicate hazards on roads that may not be readily apparent to a driver. They are normally indicated by an equilateral triangle with a white background and thick red border. Warning signs in some countries have a diamond shape in place of the standard triangular shape. The warning signs usually contain a symbol. Complex signage systems emerged with the appearance of motorcars. Initially, the use of four pictorial symbols, indicating bump, curve, intersection, and railroad crossing was agreed upon. Modern traffic warning signals can indicate any potential hazard, obstacle or condition requiring special attention. 

The following are the most common warning signs:
General caution

General warning signs are used in places where a particular hazard or condition is not covered by a standard sign. It is normally used to alert the driver regarding a potentially dangerous condition. It is normally indicated by an exclamation mark on a standard triangular sign Danger Warning Signs, Caution Sign, वॉर्निंग साइन, चेतावनी वाले संकेत चिह्न  in Karelibaug, Vadodara , Baroda Label Mfg. Co. | ID: 1781914788

-Obstacles
Warning signs can be placed next to a specific obstacle Obstacle Warning Road Sign Illustration Design Over White Royalty Free  Cliparts, Vectors, And Stock Illustration. Image 23964520.

-Animals crossing the roadway
These signs warn of wild animals that may stray on to the road.Deer Crossing Sign Y2365 - by SafetySign.com

-Unusual vehicles in roadway
These signs are found where road users could encounter slow, large or non-typical vehicles. They are common around quarries, airports, industrial zones and rural areas13 Unusual Road Signs from Around the World | Mental Floss

-Road work or construction
These signs are temporary in nature and road work, poor roads or temporary conditions on the road (flag men, survey crew, single-lane, detour, utility crew, blasting area, bump, dip, flooding, uneven pavement, freshly oiled road, loose gravel, smoke on road, trucks entering, etc). Roadworks Warning Traffic Signs in Coimbatore, Industrial Engineering  Suppliers | ID: 4252068112Printable Construction Signs Pictures - ClipArt Best - ClipArt Best | Construction  signs, Construction signs printable, Construction birthday

-Curves and corners
Such signs indicate dangerous or unexpected bends on the road. Such signs indicate if curves are to the left or the right. They also indicate the angle of the curve and if it is a single curve or a series of curves.
Curves and Corners
-Chevrons and arrows
Chevron shaped symbols or arrows are placed at the actual location of the bend or curve to assist in negotiation of the curve.
Chevron traffic sign Royalty Free Vector Image
-Tunnels
As the name suggests, these sign are used to indicate the presence of a tunnel ahead and may require the usage of headlights along with a change in light level. It naturally implies the presence of low ceiling clearance.Norway Tunnels Sign Vector Stock Vector (Royalty Free) 359683382

-Bridges
Traffic signs indicating the presence of a bridge might restrict trucks with a load limit for safety reasons
Bridges
-Traffic signals
These signals indicate the presence of traffic lights ahead and warn the driver to prepare to slow down. They may be supplemented with a flashing light.

T1-30 - Traffic (Temporary) "Traffic Signals Ahead" Box Edge Frame  Reflective Class 1 - 900mm x 600mm - Hartac Australia

-Warning signs for regulatory signs
Sometimes, especially in dense areas where a sign has been added recently, some signs may be introduced for additional warning or reminder

Regulatory Signs | Regulatory Signs | thesignstudio | Flickr

-Intersections
These signs warn of road crossings.
Intersection Signs You Must Recognize on Your Test | Driversprep.com
-Lane starts and ends
These signs indicate when a multi-lane is being narrowed, or when a passing lane is ending, or where the road is widening or a passing lane is starting. Warning signs may also warn where a highway ends or where the road changes class or type

Traffic signs - Road rules - Safety & rules - Roads - Roads and Maritime  Services
-Roads with one entry point
Such roads have only one entry or exit point. Such streets have a dead end or no outlet

Enter here one way arrow road sign start begin. Enter here words on a 3d  road or street one way sign for the point where you

-End of roadway
Such signs indicate the end of a roadway

Where should Dead End Road signs be placed?

-Pedestrian crossings
These signs are used to warn drivers of people walking in the street
Pedestrian Crossing Sign Board at Rs 2650/piece | Road Signs | ID:  15025618612
-Schools
These signs mark school zones.
Slow School Sign X5634 - by SafetySign.com
-Bicycle
These signs warn that bicycles will cross at that location
Bike sign | Bike lane, Bicycle sign, Urban bike
-Fire stations
These signs warn of firefighters enter the road with fire engines or other emergency apparatus. It is at these locations that other drivers will have to stop and let fire engines pass in case of an emergency
Fire Station Sign stock photo. Image of warning, fireman - 59800300
-Oncoming traffic
These signs are used to warn people of oncoming traffic when a road becomes a dual carriageway without a central median
File:Saudi Arabia - Road Sign - Give way to oncoming traffic.svg -  Wikimedia Commons
-Level crossing (railway crossing)
Such signs warn of level crossings ahead. A red coloured warning sign with various pictograms is commonly used
File:Singapore road sign - Warning - Level crossing with gates -  Historic.svg - Wikimedia Commons
-Falling rocks
These signs are used to indicate the hazards of fallen or falling rocks on the road ahead
Traffic sign with car and falling rocks Royalty Free Vector
-Road conditions
Such signs are used to indicate the state of the road ahead. For example - "slippery when wet", "grooved pavement", "open joints on bridge", "bump or dip ahead", etc.

Collection Of Polish Warning Signs Regarding Road Conditions,.. Stock  Photo, Picture And Royalty Free Image. Image 39687247.

B. Priority signs
Priority traffic signs indicate the order in which vehicles should pass intersection points.


Traffic Signals

Traffic lights, traffic signals, stoplights or robots are signalling devices positioned at road intersections, pedestrian crossings, and other locations to control flows of traffic.

Traffic lights follow a universal colour code which alternates the right of way accorded to users with a sequence of illuminating lamps or LEDs of three standard colours:

  • Green light
    Allows traffic to proceed in the direction denoted, if it is safe to do so and there is room on the other side of the intersection.
  • Red light
    Prohibits any traffic from proceeding. A flashing red indication requires traffic to stop and then proceed when safe (equivalent to a stop sign). 
  • Amber light (also known as 'yellow light') warns that the signal is about to change to red, with some jurisdictions requiring drivers to stop if it is safe to do so, and others allowing drivers to go through the intersection if safe to do so.

Before traffic lights, traffic police controlled the flow of traffic. An electric traffic light was developed in 1912 by Lester Wire, a policeman in Salt Lake City, Utah.  

Traffic lights (or traffic signals) are lights used to control the movement of traffic. They are placed on roads at intersections and crossings. The different colors of lights tell drivers what to do.

They help movement and help conduct an orderly flow by giving right of way to some cars and not others. They not only make car traffic a lot safer but also pedestrian traffic

They help reduce the number of accidents and make collisions at intersections a lot less frequent.

There are three main types of signal timing 

  1. fixed timing, 
  2. actuated timing, and 
  3. coordinated timing. 

Fixed timing uses the same present time intervals that do not change in accordance to traffic volume.  

Actuated timing uses a detector that is able to adjust itself to different traffic volumes. 

Coordinated timing helps minimize starting and stopping at random which helps traffic flow and is less likely to create a traffic jam.

A traffic signal setup includes controller, traffic lights and detection. The controller works as the ‘brain’ of the entire setup and has the information that is required to make sure the lights work as per the required sequences. Traffic signals can run under a variety of different modes which can be dependent on location and time of day.  

There are 6 types of signals, viz- Traffic Control Signals, Fixed time signals, Manually operated signals, Traffic actuated (automatic) signals, Pedestrian signals, Special traffic signals.

Traffic signals should be placed so the signal heads are visible at a distance upstream of the intersection and from all lanes on the approach. Approaches with poorly placed traffic signals are likely to experience an increase of rear-end conflicts and collisions.


Traffic Signals Outline Images, Stock Photos & Vectors | ShutterstockHow Do Traffic Signals Work? - YouTube

Monday, October 5, 2020

Driver Characteristics influencing road safety

Driver Characteristics influencing road safety

Driver characteristics play an important role in road safety. The physical, mental and psychological factors are the main characteristics that govern the safe operation of the vehicle on the road. The major driver characteristics are:
Physical characteristics
Vision characteristics
The field of vision includes acute or clear vision cone, fairly clear vision, cone and peripheral vision cone.        The acute or clear vision cone is around 3 to 10 degrees around the line of sight. The fairly clear vision zone is 10 to 12 degrees around the line of sight. A vision in this field can identify the color and shape. The peripheral vision extends upto 90 degrees to the left and right of the centerline of the pupil. A peripheral vision does not show stationary objects. It only detects movement of objects within this field.

        Hearing
 Hearing is a important characteristic for drivers as they must respond to auditory signals in order to maneuver their vehicles and arrive at their destination without any accidents.

        Strength
This characteristic is essential for parking heavy vehicles

Mental characteristics
The important mental characteristics of drivers that play an important role in influencing road safety are:
      • Skill
      • Intelligence
      • Experience
      • Knowledge and
      • Literacy
Apart from  the above characteristics, the driver should also possess knowledge in the below listed fields
      • Knowledge of vehicle characteristics
      • Driving practices
      • Rules of the road
      • Traffic behaviour
Physiological factors
Physiological factors affect reaction of the road user to the traffic situations. These reactions include:
      • anger
      • superstition
      • fear
      • impatience and
      • anxiety
All of the above listed factors affect traffic performance.
Environmental factors
The various environmental factors that govern the behavior of the road are:
      • Atmospheric conditions
      • Traffic facilities
      • Traffic stream characteristics
The traffic stream can be heavy traffic or mixed traffic which might limit the ability to overtake. Hence the behavior of the driver changes with traffic streams.
The two main driver characteristics are visual activity and reaction process. Other characteristics are hearing, personality and the psychology of the drivers. With the increase in speed, the peripheral vision narrows down. If it is 100 ° at 10 kmph, the vision narrows to 40° at 35 kmph.
Field of vision (FoV) decides some traffic engineering practices and functions.
  1. ANTICIPATION- DEFENSIVE DRIVING
    Anticipation is reading into things that are happening around which in turn will lead into defensive driving. ANTICIPATION enables reading the road as it is vital to constantly keep changing areas of vision between short, medium and long distances.
    Defensive driving is comprises of taking precautions before they happen. This can be done effectively by observing clues like feet under parked cars, reflections in windows, headlights coming around corners; all signs to give information to act upon.
  2. SKILL
    It is important to be able to use all of the controls smoothly and efficiently.  For example, changing gears should be done without jerking passengers about in the vehicle. Similarly, when braking, accelerating and  taking a corner care should be taken to avoid swaying about all over the place. Stopping a vehicle such that the passengers do not even feel it come to rest consistently requires SKILL and CONCENTRATION.  In any accident, the vehicle is very rarely at fault.  In the majority of cases it is driver error, due to lack of SKILL, CONCENTRATION and not ANTICIPATING the situation.
  3. ATTTITUDE
    Without the right attitude, nobody can become consistently good driver. By staying calm and tolerant in all situations and then anyone can acquire the right attitude essential to become a good driver. However, more realistic to say is any improvement in attitude is a bonus. 
  4. KNOWLEDGE  The learner drivers and the newly qualified drivers will be quite familiar with the Highway Code because of the theory test. However, no driver keeps abreast of the latest codes, rules and regulations. According to the latest regulations, drivers are required to undergo a recurring test to update their knowledge regularly 
  5. SELF-DISCIPLINE
    Strictly adhering to traffic rules like obeying traffic lights, parking in designated areas, following lane discipline are few in a long list of rules that need to be followed strictly .

vehicle design factors

SAFETY IN ROAD DESIGN

VEHICLE DESIGN FACTORS 

 Manufacturers of automobiles play a major significant role in minimizing death or severe injuries in case of traffic accidents. By initiating adequate focus on design and technological innovation with
the aim of increasing safety of lighter vehicles, death or grievous injuries due to traffic accidents can be minimized. A few technological innovations in this direction are:

  • Seat-belts
  • Passengers compartment integrity
  • Electronic stability control
  • Air bags

Crashes  resulting  in  injuries  and  deaths  are  caused  by 

  • poor  driving,  
  • unsafe  roads,  
  • unsafe  vehicles.  
  • Driver mistakes  have  many  causes,  
  • drowsiness,  
  • inexperience,   
  • aggressiveness,   
  • alcohol,   
  • distractions.

“Microsleep” events at the wheel cause a significant number of  all  serious  crashes.
Young  male  drivers  are  especially dangerous. 

Faults in road design such as

  • Narrow, unlighted and poorly signed roads
  • Missing shoulders
  • Increasing traffic as rural areas become sub-urban and traffic that exceeds design expetations.
  • Exceeding speed on rural roads is encouraged by limited traffic enforcement
  • Another cause for increased fatality rates in rural areas is reduced availability of emergency care.

 There  are  two  major  proximate  causes  of  severe  injuries in crashes:

  • The first is hard contact, either when an occupant  is  struck  by  a surface  intruding  into  the  passenger compartment  or  
  • when  an  inadequately  restrained  occupant strikes against the intact compartment. This is called  restrained  deceleration. It occurswhen  seatbelts  or  airbags  prevent  contact  with  the  compartment. In these cases, injuries tend to be less severe, but severe injury may still be caused by forces from the belt or airbag.
  • Historically, seat belts have been the most successful of all vehicular  safety  features.
  • Air  bags help distribute the narrowly applied restraining  force of a  belt,  and  they  offer some protection for unbelted occupants.
  • Side impacts are very different from frontal collisions.Intrusion into the passenger compartment is common, and shoulder–lap belts are less effective in limiting lateral mo-tion  of  the  occupant.
  • A study has concluded that light  vehicles  are  fundamentally  less  safe than heavy vehicles.
  • Moreover, the average heavier vehicle tends to be more protective of its occupants also because of its size, higher general quality, and the incorporation of more recent safety features.
  • The  disparity  in  height,  stiffness,and mass between light trucks and pas-senger cars is a major safety issue.

Sunday, October 4, 2020

Code of good practice and checklists

SAFETY IN ROAD DESIGN

Code of good practice

  • A user-friendly road will give drivers the necessary time to adapt to new and unexpected situations. In situations that are more complex or involve higher speeds, it is recommended to have an advance warning section with proper signing and instructions. 
  • A user-friendly road will give drivers a well-designed field of view with sufficient contrasts to increase alertness. It will provide good optical guiding and orienting facilities with symmetrical and orthogonal impression.
  • The amount of information also influences driver’s speed. The term used for this is density of the field of view. Efficient speed management relies on changing brightness and color contrasts to avoid subconscious speeding up.
  • Lateral field of view and its information provide the most important information to master the difficult task to hold balance on the road. Structures over the road like bridges, advertising, signaling and toll facilities should be symmetrical, of equal height, and the angle of skew to the own road should be less than 15° from perpendicular.
  • Driving reliably through a curve also critically depends on the quality of the field of view and a clear distinguishable Gestalt of the curve. 
  • The driver orientates themselves in the environment that surrounds them..To estimate their position relative to the road and to their surrounding and to other drivers, they depend on their changes of position, the changing view axis and the changing points/lines of reference in the environment. The most serious consequences arise from eye-catching objects that differ from the road axis.
  • Drivers follow the road with an expectation and orientation logic formed by their experience and recent perceptions. These affect their actual perception and reactions.

 Checklists 

A road safety inspection checklist is used to assess possible hazards in existing roads. A road safety inspection checklist is used to assess possible hazards in existing roads. This digitized checklist uses a yes-no-n/a response set and allows photos and notes to be included on relevant question items.

Administrators of various local urban bodies use checklists to check on the work of their subordinates. The following checklist should be used at different stages of the audit:  

  • Standard Checklist- 
    • The standard checklist shall be filled out in the feasibility stage/monitoring stage/ or maintenance stage. 
    • An audit using the standard check list should be carried out for any maintenance or retrofitting of the existing infrastructure.
    • Standard checklist also needs to be filled to ensure implementation of the project and subsequently for periodic inspection.
    • On all roads, a safety audit using standard checklist should be carried out every year preferably after every monsoon season.
  • Design Checklist- 
    • The design checklist shall be filled after completion of the proposed design, with a pre-requisite that a standard checklist has already been filled, in case of brownfield project.
  • Construction Checklist- 
    • The construction checklist should be filled out during the construction phase of the project.
    • Multiple construction stage audits should be carried out on construction projects that last longer than 3 months. 
    • It is recommended that the construction stage audits be carried out once every three months on longer duration projects.
  • The following flow chart depicts the process for carrying out RSA.
  • Design Stage Audit (using Design Checklist).
  • At this stage detailed design of the proposed project should be finalized and DPR/draft final design should be available.
  • Construction Stage Audit (using Construction Checklist).
Construction auditing shall be done when project is under implementation and it mainly looks after the safety aspects at the construction site. Construction stage audit shall be conducted once every three months till the end of construction.
      Post Construction Audit/ Monitoring Stage Audit (using Standard Checklist)
        This audit is done soon after completion of the project and periodically during operation of the infrastructure (once every year, preferably after monsoon season) and after completion of every maintenance works. RSA for Brownfield/ Greenfield Projects

            Conduct the Feasibility Stage Audit (using Standard Checklist).
              All deficiencies need to be listed so that they could be addressed in the detailed design.

                  Undertake safety improvement/ maintenance works
                    Deficiencies from the previous step shall be addressed / rectified by the maintenance engineer.
                      Is the project proposed on an existing road?
                        Any deficiency identified?

                              YES

                                    Revise design drawings to address the deficiencies listed in the design audit.


                                              Any deficiency identified?

                                                  NO
                                                    Good! Check next year

                                                        RSA (Road Safety Audit) can also be done on any existing road infrastructure, even if no infrastructure improvement or new infrastructure is being added. In this case, RSA (monitoring stage) shall be conducted using a standard checklist and the process after the monitoring stage shall be followed as represented in the above flow chart.

                                                        National importance of survival of transportation systems during and after all natural disasters

                                                        NATIONAL IMPORTANCE OF SURVIVAL OF TRANSPORTATION SYSTEMS A transportation system can be defined as the combination of elements and their...